Our August RPC latency benchmark measured nine keyless public endpoints and left two gaps that the post named itself: no account-backed endpoint was tested, and our own node was not in the table. This study closes both.
We registered accounts with Alchemy, Infura and QuickNode, measured their endpoints against six keyless ones, added our own production node from two separate vantage points, and added a dimension the first run missed entirely: what happens when you stop sending one request at a time and start sending the burst a strategy actually sends when a block lands.
All three account-backed endpoints are on free plans. We did not test paid tiers, and nothing below should be read as a claim about them. That constraint turned out to be more interesting than a paid comparison would have been, because the three free tiers behave nothing like one another, and two of the keyless URLs absorbed load that a keyed endpoint refused outright.
The headline result is not in the latency column. Every endpoint we reached from Frankfurt sits within about two milliseconds of every other on the wire, and the medians still span 17.7 ms to 123.0 ms, so almost none of that spread is distance. The fastest remote endpoint in the study was also the second most restrictive under load, which is worth knowing before you pick one on a latency table alone.
How this was measured
The remote runs come from the same machine and the same line as the August post: an 11th Gen Intel Core i7-11850H in Frankfurt am Main on a 1 Gbit German home line, running Linux 7.1.5 and Node 24.18.0. A residential last mile is a real caveat and we state it plainly rather than dressing it up as a datacenter; the network floors in the next section are what establish that it did not distort the comparison.
The co-located runs execute inside a BLAZED container on one of our production hosts, Node 24.14.0, reaching the node over the local socket at ws://eth:8545. Both vantage points reach the same node instance, and that detail matters more than it looks: the tunnel and the container differ only in the path between the client and the node, which is exactly the variable this study needs isolated.
Method is unchanged from August so the two studies stay comparable. Requests are interleaved round-robin rather than run endpoint by endpoint, so every endpoint sees the same network weather in the same wall-clock window. Each sample is a full JSON-RPC exchange timed with process.hrtime.bigint() on a keep-alive connection a probe call had already established, with socket reuse verified at 100%. Percentiles are nearest-rank and no samples were discarded. eth_blockNumber ran 300 rounds, eth_call 100, TCP handshakes 30, cold connects 15.
Everything below was measured on 2026-08-08: the latency matrix twice from the home line, once more from inside the container, and two propagation races, one from each vantage point. The co-located race overlapped the tail of a remote run, and since that race is a handful of idle WebSocket subscriptions the load it adds is negligible, but it is worth saying rather than leaving for someone to find.
Region is not a confound, and that had to be settled first
The obvious attack on any latency table written from one location is that it measures distance rather than providers. Before comparing anything we checked, with five ICMP packets to each endpoint’s resolved address.
Alchemy came back at 14.8 ms, QuickNode 14.9, PublicNode 13.9, BlastAPI 12.2, Tenderly 14.1, bloXroute 14.3, dRPC 16.1. Every one of those terminates within about two milliseconds of every other, because they all land in the same Frankfurt metro. The exceptions are OnFinality, whose roughly 109 ms TCP handshake places it in North America and which is labelled as such throughout, and Infura, which drops ICMP but whose 20.6 ms handshake puts it in the same European cluster as the rest.
So above roughly 15 ms, what the table shows is the provider, not the map. That is the sentence the rest of this post rests on.
The table
Warm eth_blockNumber over an established connection, plus eth_call on the same connections in the same run. Remote rows are measured from the home line, the co-located row from inside the container. The bn columns are eth_blockNumber and the call column is eth_call against the Uniswap V2 USDC/WETH pair’s getReserves(). All figures milliseconds.
| Tier | Endpoint | tcp p50 | bn min | bn p50 | bn p90 | bn p99 | call p50 | errors |
|---|---|---|---|---|---|---|---|---|
| co-located | blazed, in-container | n/a | 0.075 | 0.122 | 0.239 | 0.449 | 0.158 | 0 |
| tunnel | blazed, over SSH from home | 0.4 | 19.5 | 23.2 | 26.6 | 49.3 | 23.4 | 0 |
| free, keyed | quicknode | 21.7 | 11.2 | 17.7 | 20.8 | 32.4 | 18.7 | 0 |
| free, keyed | alchemy | 23.2 | 16.1 | 22.0 | 28.8 | 112.8 | 23.2 | 0 |
| free, keyed | infura | 20.6 | 110.9 | 119.5 | 152.1 | 219.0 | 122.4 | 0 |
| keyless | tenderly | 21.3 | 14.3 | 22.5 | 31.0 | 99.9 | 23.5 | 0 |
| keyless | publicnode | 21.0 | 25.4 | 30.0 | 36.6 | 54.0 | 31.7 | 0 |
| keyless | bloxroute | 21.4 | 23.2 | 30.3 | 36.2 | 116.5 | refused | 101 |
| keyless | drpc | 21.2 | 26.3 | 33.1 | 40.8 | 52.7 | 40.8 | 0 |
| keyless | onfinality | 109.8 | 103.3 | 107.1 | 124.6 | 1779.0 | refused | 356 |
| keyless | blastapi | 20.8 | 116.3 | 123.0 | 131.5 | 267.5 | 124.2 | 0 |
One column needs reading carefully. The tcp p50 figure is meaningless for the tunnel row, because that handshake terminates at the local end of the SSH tunnel rather than anywhere near the node; the real wire for that row is the 19.4 ms ICMP floor to the host.
A local edge does not mean a local node
Line up the previous two sections and something falls out. Infura and BlastAPI both sit on a roughly 20 ms European wire, and both answer about a hundred milliseconds slower than that wire: Infura adds 99, BlastAPI 111. That is far too much to be node execution, and it is far too consistent to be load.
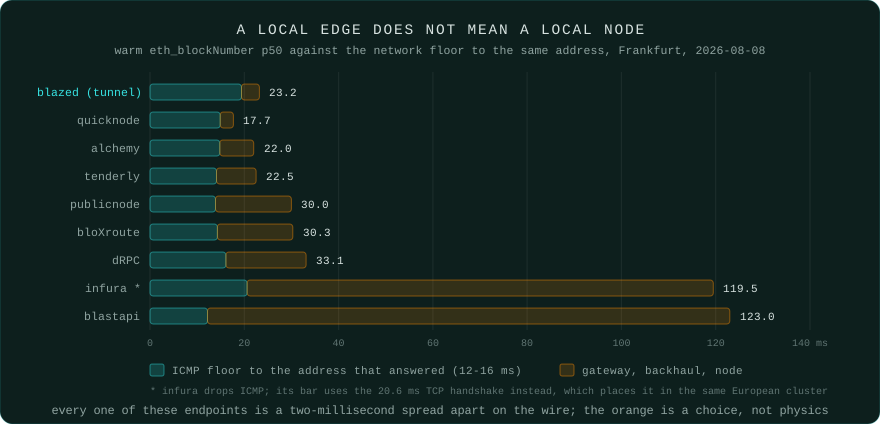
The min column is what proves it. Infura’s fastest observed call in 300 samples was 110.9 ms and it never once went below that. Load and jitter produce a distribution with a low tail; a floor that hard is a physical hop. Frankfurt to US-East and back is 85 to 95 ms, which is almost exactly the gap. Their TLS terminates at a European edge, in at least one case a Cloudflare point of presence in Frankfurt visible in the cf-ray header, so what you are connecting to is an edge two milliseconds away that then carries your request across the Atlantic to the machine holding the chain data.
This is the part of provider marketing that survives scrutiny least well, and it also invalidates the most common way people check RPC latency. Pinging your provider tells you where their edge is. It tells you nothing whatsoever about where the node is, and the node is what answers your question. Our own August post leaned on that ICMP floor as though it decomposed the whole picture, and this run is the correction: the floor is real, but for some providers the interesting hop happens entirely behind it.
The node itself is not the slow part, and now we can say by how much
The August post inferred the cost of real EVM work indirectly, by watching eth_call against eth_blockNumber through a hundred milliseconds of wire noise, and landed on a range of +0.10 to +0.55 ms. Measuring on the box gives a clean answer.
Co-located, eth_blockNumber costs 0.122 ms at the median. That is a counter already in memory. eth_call against the Uniswap V2 USDC/WETH pair’s getReserves(), which requires a real state read and an EVM execution, costs 0.158 ms. The difference is 36 microseconds.
Everything a remote provider bills you for beyond those 36 microseconds is transport and gateway rather than computation. The same node instance that answers in 0.122 ms inside the container answers in 23.2 ms to the same client over a tunnel, and that 23.2 breaks down as roughly 19.4 ms of distance, roughly 3.7 ms of SSH overhead, and 0.122 ms of Ethereum. Over 99% of what you wait for on a remote RPC call is the packet travelling, and none of it is the chain.
From the outside, our node is just another endpoint
Look back at the table and note where the tunnel row lands. BLAZED sits at 23.2 ms, slower than QuickNode at 17.7 and slower than Alchemy at 22.0.
That is not a bad result hidden in a table; it is the result, and it is exactly what physics predicts. Our host is 19.4 ms from that client and Alchemy’s Frankfurt edge is 14.8 ms away. A node further from you answers later, and no amount of engineering on our side changes it. We are not claiming a faster node. Alchemy runs good hardware, and any well-run execution client answers a hot state read in well under a millisecond regardless of whose rack it sits in.
The claim is narrower and much stronger: the network path is removable, and the only way to remove it is to run the code on the box. The same node, same client version, same day, measured from where a customer’s container actually sits, answers in 0.122 ms. The 190x gap between those two rows is not a claim about the node. It is the cost of the wire, priced.
Where the free tiers actually differ
Every provider median you have ever read, including the ones above, is measured at concurrency 1. No bot runs at concurrency 1. When a block lands, a strategy fires everything it has at once, and that is where these endpoints stop resembling each other. So the v2 harness ramps: 5, 10, 25, 50, 100 and 200 simultaneous eth_call requests, counting how many come back rather than how fast.
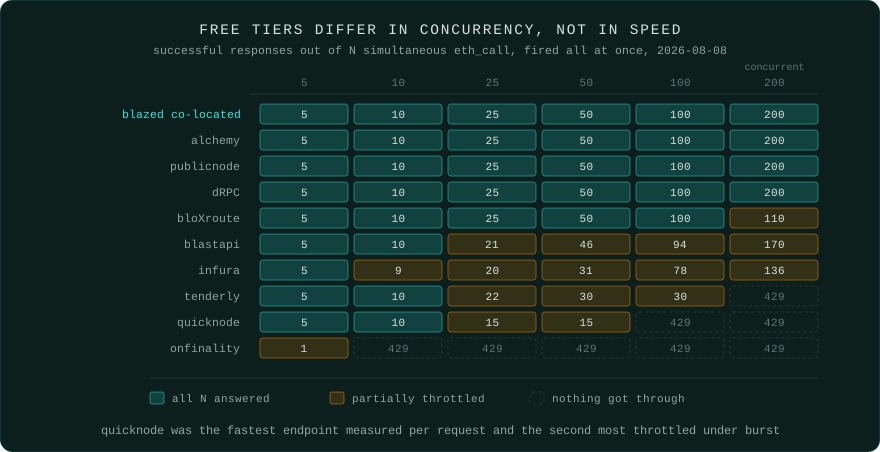
Alchemy’s free tier took all 200 concurrent requests cleanly and peaked at 502 requests per second, which is considerably more headroom than we expected to get for nothing. Infura began throttling at 10 and returned 136 of 200. QuickNode, the fastest endpoint in the entire study per request, refuses everything above 15 concurrent with HTTP 429. Among the keyless endpoints, PublicNode and dRPC also cleared the full 200, BlastAPI throttled from 25, Tenderly ceilings around 30, and OnFinality returned one response out of five.
Two things fall out of that. The first is that “free tier” describes a billing relationship and nothing else: Alchemy’s free plan absorbed more than thirteen times the burst QuickNode’s free plan did. The second is that holding an account key is not in itself worth anything under load. Two keyless public URLs outlasted a keyed endpoint by the same thirteen-fold margin, so if your reason for signing up is throughput rather than support or dashboards, check that the plan you are on actually delivers it.
The QuickNode result is the one worth dwelling on, because it is the cleanest warning in the dataset against picking on latency alone. Per request it was the fastest remote endpoint we measured all day. Under burst it was the second most restrictive thing in the table. A median tells you nothing about which of those you are picking.
The co-located node is a different shape again. At 200 concurrent it throttled nothing, sustained 23,241 requests per second, and held a p50 of 5.42 ms with a p99 of 5.84 ms. The interesting part is not the throughput number, it is that the sub-10 ms figure we put in our own marketing survives its own worst case rather than describing an idle box. Compare with Alchemy, whose p50 moves from 22.0 ms at concurrency 1 to 227.8 ms at 200 concurrent. Ten times the median, at precisely the moment every strategy in the market is hitting the same gateway.
The same block, seen by six providers
A round-trip benchmark measures how fast a provider answers a question. It says nothing about how fast the provider learns. For anything triggered by a new block, that second question decides whether you are early or late, and it is invisible to every latency test that only measures request and response.
We opened newHeads subscriptions to six providers from a single process on a single monotonic clock, for thirty minutes from the home line, covering 150 distinct heads. Deltas are relative to whichever provider delivered each block first, so our own last mile cancels out.
BLAZED is deliberately absent from this run. Subscribing to our own node from home would have measured the SSH tunnel rather than the node, and the point of this race is to establish the ordering among providers with nothing of ours in the table. It is the control. The co-located node enters in the next section, measured from the only place where its number means anything.
Coverage turned out to be the finding, so it goes first:
| Provider | Heads delivered |
|---|---|
| alchemy | 150 of 150 |
| publicnode | 150 of 150 |
| quicknode | 149 of 150 |
| drpc | 149 of 150 |
| tenderly | 149 of 150 |
| infura | 68 of 150 |
Infura went silent for 885 consecutive seconds while holding the socket open. No error frame, no close, no reconnect. A bot subscribed to that socket would have believed Ethereum stopped producing blocks for just under fifteen minutes, and would have had no signal of any kind that anything was wrong. This is worse than any latency number in this study, and it is worth noting that a harness which simply averaged whatever arrived would have reported Infura as unremarkable and moved on. Coverage has to be counted explicitly or it hides.
Across the 67 blocks all six delivered:
| Provider | Delivered first | p50 | p90 | max |
|---|---|---|---|---|
| quicknode | 40x | 0 | 138 | 934 |
| infura | 26x | 16 | 158 | 273 |
| publicnode | 0x | 101 | 171 | 1881 |
| alchemy | 0x | 117 | 172 | 1528 |
| drpc | 1x | 119 | 195 | 1198 |
| tenderly | 0x | 966 | 1974 | 2565 |
The spread between the first and last delivery of the same block was 966 ms at the median and 2565 ms at worst. Ethereum produces a block every twelve seconds, so being a second behind on the head burns eight percent of the slot before your code has been told the slot exists.
The same race, from inside a container
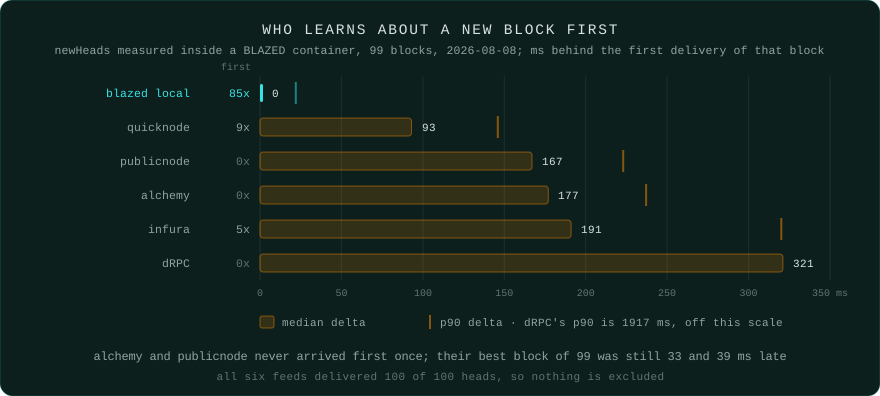
That race is the control: it shows the ordering among providers from a neutral vantage, with BLAZED absent. A second race repeats it from the position a customer’s code actually occupies, inside a BLAZED container, with the co-located node added as a seventh feed. Twenty minutes, 100 distinct heads, blocks 25709801 to 25709899. All six remote providers delivered 100 of 100 this time, so nothing is excluded and 99 blocks are compared.
| Provider | Tier | Delivered first | min | p50 | p90 | max |
|---|---|---|---|---|---|---|
| blazed, local | co-located | 85x | 0 | 0 | 22 | 302 |
| quicknode | free, keyed | 9x | 0 | 93 | 146 | 1247 |
| infura | free, keyed | 5x | 0 | 191 | 320 | 632 |
| publicnode | keyless | 0x | 39 | 167 | 223 | 2477 |
| alchemy | free, keyed | 0x | 33 | 177 | 237 | 1572 |
| drpc | keyless | 0x | 133 | 321 | 1917 | 4118 |
The local node saw the new head first on 85 of 99 blocks with a median delta of zero. The best remote feed was 93 ms behind at the median and Alchemy was 177 ms behind. Alchemy and PublicNode never arrived first even once across 99 blocks; their best single blocks were still 33 and 39 ms late, which means they were never close rather than occasionally unlucky.
The local node also lost fourteen times, and QuickNode and Infura tied with it often enough to take nine and five blocks outright. That texture is worth keeping. A co-located node is not magic, it is one hop closer to a gossip network that has its own variance, and on any given block a well-connected provider can be ahead.
The obvious objection is that of course the local node wins when the clock is on the same machine as the node. Yes. That is the product, and it is why the first race exists as a control with BLAZED removed. The measurement is deliberately taken from where the customer’s code runs, because that is the only place where the number affects anything. For an MEV searcher, a 93 ms median head start over the fastest remote feed, and 177 ms over Alchemy, is most of the window in which a backrun still exists.
Does it reproduce
We ran the remote matrix twice, independently, same method and same endpoints both times:
| Endpoint | First run p50 | Second run p50 |
|---|---|---|
| alchemy | 22.2 | 22.0 |
| quicknode | 17.4 | 17.7 |
| infura | 117.9 | 119.5 |
| tenderly | 22.0 | 22.5 |
| publicnode | 26.6 | 30.0 |
| drpc | 31.9 | 33.1 |
| blastapi | 120.8 | 123.0 |
| bloxroute | 29.8 | 30.3 |
Nothing moved more than 3.4 ms. The ordering is unchanged except that Alchemy and Tenderly trade places, and they sit within half a millisecond of each other in both runs, which is not a ranking so much as a tie. This is one afternoon in one city and we are not going to pretend otherwise, but it is not one lucky window.
Scope
This is a free-plan comparison, and we did not test paid or dedicated deployments. A paid plan would raise the burst ceilings above, so read the ramp as a floor rather than a verdict on any provider. What it does not change is the latency column: Infura’s hundred-millisecond backhaul is a routing decision, and no amount of spend moves a datacenter closer to Frankfurt.
We measured from one vantage point on a residential line in one city, on one day. A run from Ashburn would produce different absolute numbers and, we would expect, the same structure: a flat wire cost, a variable gateway cost, and a node cost near zero. The August transport study stands alongside this one rather than being repeated in it, with a unix domain socket at 2.9 µs against 38.8 µs for loopback HTTPS; the transport comparison covers why the framing matters once the wire is gone.
Run it yourself
The harness is dependency-free Node built-ins and takes its endpoint list from a file you edit. It is in the rpc-latency-matrix-v2 companion project, reads keys from the environment so nothing sensitive lands in the repo, writes every raw sample to JSON so you can recompute the percentiles yourself, and includes the burst ramp phase:
ALCHEMY_KEY=... INFURA_KEY=... QUICKNODE_URL=... node matrix.mjs
The propagation race is newheads-race.mjs in the same folder, and the version that runs inside a container against a local node is the same file with one extra endpoint. The network floor is a plain ping -c 5 against each endpoint’s resolved address, which takes ten seconds and is the single highest-value check in this entire post; if your provider’s median is a hundred milliseconds above its own ping, you have found a transatlantic hop.
Whatever you run, report percentiles rather than means. The mean is where tail latency goes to hide, and the tail is what actually costs you a block.
Conclusion
Three numbers carry this study. A warm call to an account-backed provider from Frankfurt cost 17.7 to 119.5 ms at the median, of which about 15 ms was the wire and the rest was a routing decision the provider made and you cannot see. The same call to a node in the same container cost 0.122 ms, of which 36 microseconds was the only part that had anything to do with Ethereum. And on the push side, the co-located node learned about a new block first on 85 of 99 blocks, a median 93 ms ahead of the fastest remote feed in the study.
If you are choosing among free tiers, choose on the burst ceiling and on whether the subscription stays up, because that is where they differ by an order of magnitude. The median is the least useful column of the three: two of them landed 4.3 ms apart, and the third landed a hundred milliseconds away for reasons that have nothing to do with its node. Signing up gets you a dashboard and a quota; it does not automatically get you throughput, and one of the keyless URLs in this table outperformed a keyed one under load.
What no plan on any pricing page sells you is a shorter cable. The distance between your code and the node is not something a provider is in a position to change, which is why it is the term that dominated every remote measurement here.
That is the piece BLAZED.sh changes, by putting your container on the host that runs the node and handing it a local socket at ws://eth:8545. Ethereum mainnet is the only chain we run in production today and the networks pages are explicit about what is live and what is planned. If you want the strategy-level version of this argument, why MEV is a latency game walks through the read-then-act budget; if you are weighing providers on cost rather than latency, the pricing model comparison covers compute units against credits, and our own RPC pricing is per-request rather than blended.