Every RPC provider sells latency and almost nobody publishes a distribution. You get a marketing average, occasionally a p95 on a status page, and never the methodology. We wrote a transport comparison last June that leaned on illustrative ranges because we had not measured them ourselves, and that has bothered us since. So this post measures instead: nine public Ethereum endpoints, up to 300 samples each, percentiles rather than means, a race between three subscription feeds to see who learns about a new block first, and a separate benchmark of what a JSON-RPC round-trip costs when there is no network in the path at all.
The interesting result is not the ranking. It is the split. On the fastest endpoint we tested, the Ethereum node’s own work was a rounding error and roughly three quarters of the wall clock was the packet getting there and back. On the slowest, the node was still a rounding error and the gateway was the problem. If you want a faster RPC call, the numbers say to attack the path, not the client.
How this was measured
Everything below came from one workstation, an 11th Gen Intel Core i7-11850H running Linux 7.1.4 and Node 24.18.0, sitting on a Telefónica consumer line in Frankfurt am Main. That vantage point matters and we come back to it, because a residential last mile adds real milliseconds that have nothing to do with any provider.
Requests were interleaved round-robin rather than run endpoint-by-endpoint, so every endpoint saw the same network weather in the same wall-clock window. Each measurement is a full JSON-RPC exchange timed with process.hrtime.bigint() around a request on a keep-alive HTTPS connection that a probe call had already established; socket reuse was verified at 100% for every endpoint. Percentiles are nearest-rank on the sorted sample and no samples were discarded. The eth_blockNumber phase ran 300 rounds, eth_call ran 100, TCP handshakes 30, and cold connections 15. The whole HTTPS run took six minutes on 2026-08-01, starting 11:50 UTC.
We also measured ICMP round-trip to each endpoint’s resolved IP, 30 packets per host, so that the network component could be separated from everything else. The newHeads race ran as its own eight-minute window with all three subscriptions in one process, so every arrival timestamp comes from the same monotonic clock and no cross-machine skew is involved. And separately, a Go 1.26.5 harness on the same laptop measured the same fixed JSON-RPC exchange over seven local transports against a responder that does no work at all, which isolates the cost of the transport itself. That machine runs the powersave CPU governor, so if anything the microsecond figures below are pessimistic.
The endpoints are the public, keyless ones. We did not test paid Infura, Alchemy or QuickNode tiers, because those require an account and a key per provider, and a shared public endpoint is not a fair proxy for a dedicated paid plan. Where a provider appears here, the URL we hit is named exactly.
Update, 2026-08-10: we have since registered accounts and closed half of this gap. The follow-up study measures account-backed Alchemy, Infura and QuickNode endpoints, adds a burst-concurrency dimension this run missed, and includes our own node measured from two vantage points. Those accounts are on free plans, so paid tiers remain untested. It also corrects the decomposition below: the ICMP floor is real, but for several providers the interesting hop happens behind it.
What a warm remote call actually costs
This is eth_blockNumber, the cheapest question you can ask an Ethereum node, over an established TLS connection. All figures in milliseconds.
| Endpoint | n | ICMP | min | p50 | p90 | p99 | max |
|---|---|---|---|---|---|---|---|
gateway.tenderly.co/public/mainnet |
300 | 16.4 | 15.5 | 21.9 | 51.6 | 660.6 | 1422.0 |
ethereum-rpc.publicnode.com |
300 | 16.4 | 18.9 | 25.3 | 29.9 | 49.2 | 84.7 |
eth.rpc.blxrbdn.com |
299 | 16.4 | 24.4 | 31.4 | 34.2 | 53.4 | 65.2 |
eth.drpc.org |
300 | 16.6 | 25.8 | 32.5 | 47.1 | 82.3 | 280.0 |
rpc.flashbots.net |
300 | blocked | 107.8 | 112.3 | 114.7 | 144.8 | 408.5 |
eth.api.onfinality.io/public |
50 | blocked | 100.4 | 107.1 | 111.2 | 141.9 | 141.9 |
eth-mainnet.public.blastapi.io |
300 | 16.4 | 110.4 | 118.7 | 124.0 | 215.4 | 340.4 |
1rpc.io/eth |
189 | 16.5 | 112.5 | 122.9 | 140.4 | 346.1 | 346.6 |
rpc.mevblocker.io |
299 | 16.6 | 124.5 | 134.9 | 147.1 | 204.7 | 399.4 |
Two endpoints are worth a caveat before anyone quotes the table. Flashbots Protect and MEV Blocker are transaction-privacy RPCs; serving fast reads is not what they are for, and reading their read path as a general-purpose gateway benchmark would be unfair to both. OnFinality and 1RPC rate-limited us partway through, which is why their sample counts are short; 1RPC returned 189 of 300 and OnFinality 50 of 300, so its p99 rests on fifty samples and should be treated as a hint rather than a number. Four of the nine endpoints throttled or refused part of the run, which is itself a finding about free public infrastructure.
eth.llamarpc.com returned HTTP 521 throughout and never entered the run. eth.merkle.io answered a curl probe and then served the benchmark client a 403, so it was dropped. Ankr’s public endpoint now demands an API key and Alchemy’s public demo endpoint answered every probe with HTTP 429, so both were excluded rather than measured badly.
Separating physics from architecture
The ICMP column is the useful one. A ping round-trip to the endpoint’s own IP is the floor: no TLS, no HTTP, no gateway, no node, just the packet’s travel time from this line to that address and back. It came in remarkably flat, between 12.8 and 14.4 ms at minimum and 16.4 to 16.6 ms on average across every endpoint with a European edge, whether that edge was Cloudflare, Google or AWS, because they all terminate in the same Frankfurt metro. Loopback on this machine, for scale, completes a TCP connect in 0.03 ms. Flashbots and OnFinality drop ICMP, and their ~110 ms TCP handshakes place them in North America.
Subtract that floor from the p50 and what remains is everything the provider adds after the packet arrives: the hop from their edge to wherever the node actually lives, the gateway, auth, metering, load balancing, and finally the node.
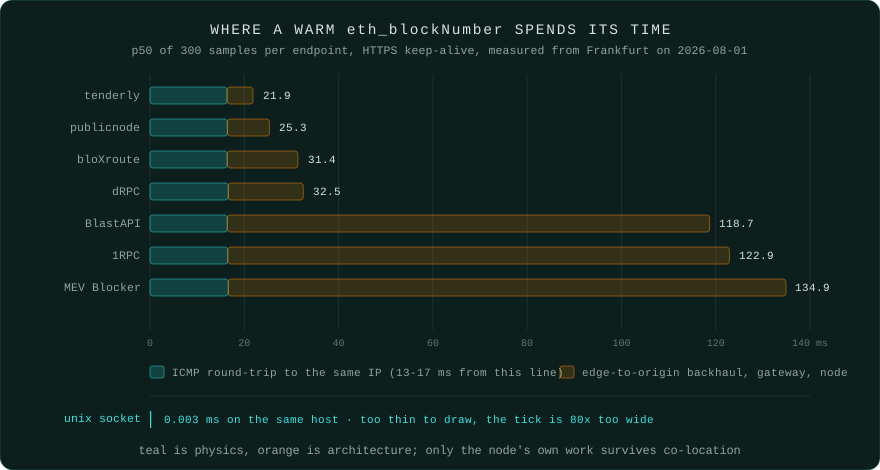
Tenderly adds about 5.5 ms on top of the wire. PublicNode adds about 9. dRPC and bloXroute add roughly 15. BlastAPI, 1RPC and MEV Blocker add 102, 106 and 118 ms respectively, which is far too much to be node execution and is almost certainly the distance between the edge that terminated our TLS and the machine that answered the question. TLS terminating 16 ms away tells you nothing about where the node is.
That is the part of the industry’s latency story that gets skipped. An anycast edge makes the handshake feel local while the actual Ethereum node may be an ocean away, and the only way to see it is to measure the wire separately from the response.
The node is not the slow part
If node execution were the bottleneck, asking a harder question would cost meaningfully more. So we asked one: eth_call against the Uniswap V2 USDC/WETH pair’s getReserves(), which requires a state read and an EVM execution, on the same warm connections in the same run.
| Endpoint | eth_blockNumber p50 |
eth_call p50 |
Marginal cost of the EVM call |
|---|---|---|---|
ethereum-rpc.publicnode.com |
25.25 | 25.35 | +0.10 |
eth-mainnet.public.blastapi.io |
118.65 | 118.94 | +0.29 |
eth.api.onfinality.io/public |
107.09 | 107.62 | +0.54 |
gateway.tenderly.co/public/mainnet |
21.89 | 22.44 | +0.55 |
eth.drpc.org |
32.50 | 40.81 | +8.31 |
rpc.mevblocker.io |
134.90 | 39.68 | -95.21 |
On four of six, doing real EVM work cost between a tenth and half a millisecond more than returning a cached integer. A modern execution client answers a hot state read in well under a millisecond, and these numbers are consistent with that. Whatever is making your RPC call slow, it is not the EVM.
MEV Blocker deserves its own sentence, because its eth_call was 95 ms faster than its eth_blockNumber. A node cannot execute a contract call faster than it can return a counter, so that gap is method-specific handling somewhere in front of the node, not node speed. Flashbots Protect, 1RPC and bloXroute did not return usable eth_call results during this run, either refusing the method or throttling us out of it, which is why those rows are absent.
Per-method behaviour like this is exactly why we publish a per-method cost table rather than a single blended rate; the JSON-RPC method reference lists what each call does and what it costs in credits, and the RPC pricing page covers the model.
WebSocket against the same providers
Three of the endpoints offered a working public WebSocket. We ran the same round-robin loop over wss://, 300 samples each.
| Endpoint | Handshake | min | p50 | p90 | p99 | max | eth_call p50 |
|---|---|---|---|---|---|---|---|
wss://ethereum-rpc.publicnode.com |
194.0 | 15.4 | 20.0 | 24.1 | 57.5 | 243.6 | 19.5 |
wss://gateway.tenderly.co/public/mainnet |
198.2 | 14.3 | 22.5 | 47.7 | 351.3 | 680.2 | 22.0 |
wss://eth.drpc.org |
136.0 | 18.4 | 25.9 | 35.1 | 125.7 | 140.3 | 24.4 |
Compared with the HTTPS numbers, PublicNode came in 5.3 ms faster on the p50, dRPC 6.6 ms faster, and Tenderly 0.6 ms slower. The WebSocket run happened in a separate window minutes after the HTTPS run, so endpoints are paired against each other within a run but not across runs; treat the cross-run delta as indicative rather than exact.
The size of the effect is the point. Dropping HTTP framing for WebSocket frames on a remote connection buys single-digit milliseconds against a 16 ms wire and a gateway that may cost a hundred. It is worth doing, and it is not the lever people think it is. The real reason to hold a WebSocket open is server push: eth_subscribe for new heads, logs, and pending transactions, which HTTP simply cannot do without polling.
Note also what the connection costs to establish: 136 to 198 ms for the WebSocket handshake, five to ten times a steady-state call. Anything that reconnects per request, or per Lambda invocation, pays that repeatedly.
Cold connections
Speaking of which, here is what a fresh HTTPS connection costs when DNS is already cached, broken into the moment TCP completes, the moment TLS completes, and the arrival of the first JSON-RPC response.
| Endpoint | TCP done | TLS done | First response p50 | p99 |
|---|---|---|---|---|
gateway.tenderly.co/public/mainnet |
24.0 | 46.6 | 67.9 | 358.5 |
ethereum-rpc.publicnode.com |
24.1 | 48.8 | 75.8 | 118.1 |
eth.drpc.org |
22.4 | 47.8 | 81.7 | 148.0 |
eth-mainnet.public.blastapi.io |
21.8 | 47.4 | 168.2 | 422.5 |
1rpc.io/eth |
22.3 | 49.0 | 170.0 | 193.8 |
rpc.mevblocker.io |
23.0 | 48.4 | 187.3 | 227.2 |
eth.api.onfinality.io/public |
109.5 | 219.5 | 323.1 | 342.1 |
rpc.flashbots.net |
121.8 | 242.3 | 357.7 | 417.7 |
TLS 1.3 costs almost exactly one extra round-trip, visible as the 23 to 27 ms gap between the TCP and TLS columns on every Frankfurt-edged endpoint and 110 to 120 ms on the two North American ones. Overall a cold call cost 1.4 to 3.2 times a warm one, and the endpoints with the best warm numbers paid the biggest multiple, because for them the handshake is most of the call. If your bot opens a connection per opportunity, the cold column is the number you are actually running on.
The tail is the product
Medians make everything look fine. Tenderly had the fastest p50 in the entire set at 21.9 ms and also the worst single call at 1422 ms, with a p99 of 660.6 ms, thirty times its own median.
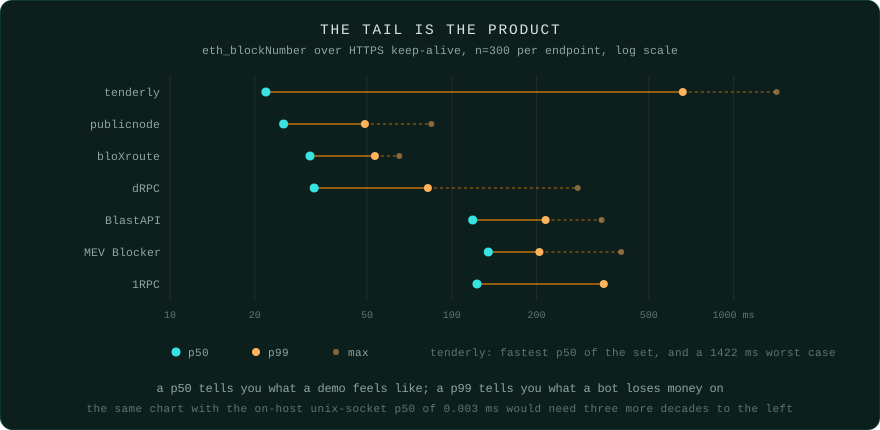
For a dashboard, a 660 ms p99 is invisible. For an arbitrage loop that reads four pools before deciding, it is four independent chances to be half a second late, and those chances are not independent of market conditions: tails fatten exactly when volatility spikes and everyone hits the same gateways at once. This is the argument we made qualitatively in why MEV is a latency game, and it is what the distribution looks like when you actually plot it.
Only PublicNode and bloXroute kept p99 under 55 ms, roughly double their own medians, which is the shape you want. Predictability is worth more than a good average.
The same block, seen by three providers
A round-trip benchmark measures how fast a provider answers a question. It says nothing about how fast the provider learns. For anything triggered by a new block, that second question decides whether you are early or late, and it is invisible to every latency test that only measures request and response.
So we opened newHeads subscriptions to three providers from a single process on a single clock, and recorded when each one delivered each block hash. Deltas are relative to whichever provider arrived first, which means our own network path cancels out: whatever last mile we sit on applies equally to all three. The window was eight minutes on 2026-08-01 starting 12:20 UTC, covering blocks 25659986 to 25660024. All three delivered all 40 heads, with no drops, and the first block was discarded because subscriptions register at slightly different moments. Figures are milliseconds behind the fastest delivery of that block.
| Provider | Delivered first | min | p50 | p90 | max |
|---|---|---|---|---|---|
wss://ethereum-rpc.publicnode.com |
38 of 39 | 0 | 0 | 0 | 975 |
wss://eth.drpc.org |
0 of 39 | 96 | 264 | 1704 | 2474 |
wss://gateway.tenderly.co/public/mainnet |
1 of 39 | 0 | 765 | 1338 | 2020 |
The gap between the first and the last delivery of the same block was 937 ms at the median, 1728 ms at p90, and 2474 ms at worst. Ethereum produces a block every twelve seconds. Being a second behind on the head is roughly eight percent of the slot gone before your code has been told the slot exists.
One honest complication: an earlier, partially degraded run fifteen minutes before this one had dRPC arriving first on 74% of blocks and PublicNode second. The ordering flipped completely between windows, so do not read this table as a standing ranking of the three. What is stable across both runs is the shape: on a public subscription feed, the same block reaches different consumers hundreds of milliseconds to seconds apart, and which one is ahead is not something you can rely on.
This measures when a provider’s fan-out reached us, which bundles their own propagation, their subscriber fan-out, and the shared path to our machine. It does not measure when the block was produced, and it does not measure a co-located node, which we did not have in this run. What it does establish is that the push side of a remote provider carries a variance budget of its own, on top of the request-response numbers above, and that budget is measured in whole seconds rather than milliseconds.
What a call costs with no network in it
The other half of the question is what remains once the wire is gone. This harness serves one identical pre-serialised JSON-RPC response from a responder that does no work whatsoever, over seven local transports, and times 20,000 round-trips per transport after 2,000 warm-up iterations. Whatever it measures is the transport and nothing else. All figures in microseconds.
| Transport | min | p50 | p90 | p99 | p99.9 | max |
|---|---|---|---|---|---|---|
| Unix domain socket | 2.8 | 2.9 | 3.1 | 6.4 | 16.8 | 273.0 |
| TCP loopback | 5.5 | 5.7 | 6.3 | 9.8 | 26.2 | 209.1 |
| WebSocket over TCP loopback | 6.2 | 6.7 | 11.7 | 22.8 | 76.1 | 290.2 |
| WebSocket over TLS loopback | 7.5 | 7.8 | 10.9 | 17.4 | 69.8 | 317.0 |
| HTTP over unix socket | 16.8 | 29.3 | 37.4 | 83.6 | 266.2 | 404.7 |
| HTTP keep-alive, loopback | 24.8 | 35.5 | 45.6 | 85.2 | 267.4 | 560.9 |
| HTTPS keep-alive, loopback | 28.8 | 38.8 | 49.9 | 99.9 | 298.0 | 811.0 |
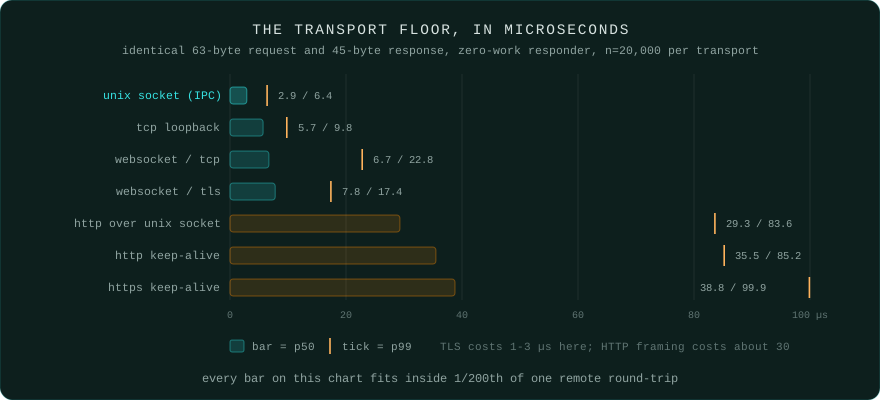
Three things fall out of this. A unix domain socket is genuinely twice as fast as TCP loopback, 2.9 µs against 5.7, because it skips the IP stack entirely rather than looping it back. TLS is nearly free at this message size on a CPU with AES-NI, adding 1.1 µs to the WebSocket case and 3.3 µs to HTTP. And HTTP framing is the expensive part of local RPC: parsing headers and managing request lifecycle costs around 30 µs, an order of magnitude more than moving the bytes.
That last one is the practical takeaway for anyone already running local. If your node is on the same box and you are still talking to it over HTTP, you are paying roughly ten times the framing cost of a persistent socket for no benefit, because HTTP’s advantages are all about statelessness across a network you no longer have.
The absolute scale is the headline, though. The slowest local transport we measured, HTTPS over loopback at 38.8 µs, is 1/560th of the fastest remote p50 in this study. A unix socket at 2.9 µs is roughly 1/7500th of it.
What this means, and what we did not measure
Put the two halves together and the structure is clear. A remote call is a network round-trip you cannot shorten, plus a gateway path you did not choose, plus a node that is not the problem. Tuning your client does nothing to any of the three. Moving the code onto the node deletes the first two and leaves the third, which is the only one that was ever about Ethereum. The transport comparison post argued that from first principles; these numbers are what it looks like measured.
Where BLAZED.sh sits in that picture is the co-located case: your container or script runs on the same host as a fully synced Ethereum mainnet node and reaches it over a local socket at ws://eth:8545, so the packet never enters the internet. Ethereum mainnet is the only chain we run in production today; the networks pages are explicit about what is live and what is planned.
Now the honest part, because a benchmark post that hides its gaps is worth nothing.
We did not measure a BLAZED.sh production node from inside a customer container in this run. The sub-10 ms local round-trip figure on our own site is a published product number, and this post does not re-derive it. Nothing measured here contradicts it: a node answering a hot read in well under a millisecond, plus a local transport costing microseconds, plus a metering proxy hop, comfortably fits inside 10 ms. But “consistent with” is not “measured”, and we are not going to blur those two in a post whose entire value is that its numbers are real. An in-container measurement against our production node is the obvious follow-up and we will publish it as its own dataset.
Update, 2026-08-10: that dataset is now published. Measured from inside a container, eth_blockNumber costs 0.122 ms at the median and a real eth_call costs 0.158, so the marginal cost of EVM execution is 36 µs. The same node answers the same client in 23.2 ms over an SSH tunnel from this line, which is slower than Alchemy from here, and the follow-up leads with that rather than hiding it.
We also did not test paid provider tiers, we measured from a single vantage point on a residential line, and the whole study is one time window on one day. A run from a datacenter in Ashburn would produce different absolute numbers and, we would expect, the same structure: a flat wire cost, a variable gateway cost, and a node cost near zero.
Run it yourself
The core loop is short enough to paste. This is the warm-connection measurement, minus the round-robin scheduling and the endpoint bookkeeping.
import https from 'node:https';

const URL_STR = process.env.RPC_URL || 'https://ethereum-rpc.publicnode.com';
const BODY = JSON.stringify({ jsonrpc: '2.0', id: 1, method: 'eth_blockNumber', params: [] });
const SAMPLES = 300;

// One agent, one socket, kept open: we want steady state, not connection setup.
const agent = new https.Agent({ keepAlive: true, maxSockets: 1 });

function call() {
  const u = new URL(URL_STR);
  return new Promise((resolve, reject) => {
    const started = process.hrtime.bigint();
    const req = https.request({
      agent,
      hostname: u.hostname,
      port: 443,
      path: u.pathname + u.search,
      method: 'POST',
      headers: { 'content-type': 'application/json', 'content-length': Buffer.byteLength(BODY) },
    }, (res) => {
      res.resume();
      res.on('end', () => resolve(Number(process.hrtime.bigint() - started) / 1e6));
    });
    req.on('error', reject);
    req.end(BODY);
  });
}

function percentile(sorted, p) {
  const rank = Math.ceil((p / 100) * sorted.length);
  return sorted[Math.min(sorted.length - 1, Math.max(0, rank - 1))];
}

async function main() {
  for (let i = 0; i < 5; i++) await call(); // warm up TCP, TLS and any lazy routing
  const samples = [];
  for (let i = 0; i < SAMPLES; i++) samples.push(await call());
  samples.sort((a, b) => a - b);
  console.log(
    `n=${samples.length}`,
    `min=${samples[0].toFixed(1)}`,
    `p50=${percentile(samples, 50).toFixed(1)}`,
    `p99=${percentile(samples, 99).toFixed(1)}`,
    `max=${samples[samples.length - 1].toFixed(1)}`,
  );
  agent.destroy();
}

main().catch(console.error);
Run it against a remote endpoint, then swap node:https for node:http and point it at a node on the same machine. The gap you see is the number this whole post is about. Do not report the mean; the mean is where tail latency goes to hide.
The full harness behind the tables above, including the round-robin scheduling, the TCP handshake phase and the cold-connection phase, is in the rpc-latency-matrix companion project. It has no dependencies beyond Node built-ins, writes every raw sample to JSON so you can recompute the percentiles yourself, and takes an endpoint list you can edit. The block-propagation race is newheads-race.js in the same folder. An ethers-based single-endpoint version that also speaks WebSocket is in rpc-latency-benchmark. The ICMP floor is a plain ping -c 30 against the endpoint’s resolved IP.
Conclusion
A warm Ethereum RPC call from Frankfurt to a public endpoint cost between 21.9 and 134.9 ms at the median in this study, of which about 16 ms was the wire and between 5 and 118 ms was the provider’s own path. The Ethereum node’s contribution, measured as the marginal cost of a real EVM state read over a cached counter, was under a millisecond nearly everywhere. On the push side, the same block head reached three subscription feeds 937 ms apart at the median. On the same machine, the identical exchange costs 2.9 µs over a unix socket and 38.8 µs over loopback HTTPS.
Switching transports on a remote connection moves single-digit milliseconds. Moving the code to the node deletes the two terms that dominate. That is the whole argument for co-location, and now it has numbers behind it rather than adjectives. If you want to see what it does to a real strategy loop, the MEV latency piece walks through the read-then-act budget, and the mempool access guide covers subscribing locally instead of downstream of someone else’s relay.